Application logs
In this section we'll look at collecting and exploring the logs from our workloads. OpenTelemetry supports several log collection methods, including the filelog receiver which can be configured to collect the logs from the container runtime log directories. Because the OpenTelemetry collector pods need to have the direct access to these log files on each worker node, we need to deploy them with the DaemonSet mode.
The receiver can be configured to include/exclude the logs from the specific namespaces, parse the logs from the different container runtimes and manipulate the metadata of each log entry and etc:
exclude:
- /var/log/pods/*-system_*/*/*.log
- /var/log/pods/cert-manager_*/*/*.log
- /var/log/pods/grafana_*/*/*.log
- /var/log/pods/other_*/*/*.log
include:
- /var/log/pods/*/*/*.log
include_file_name: false
include_file_path: true
operators:
- id: get-format
routes:
- expr: body matches "^\\{"output: parser-docker
- expr: body matches "^[^ Z]+ "
output: parser-crio
- expr: body matches "^[^ Z]+Z"
output: parser-containerd
type: router
- id: parser-crio
output: extract_metadata_from_filepath
regex: ^(?P<time>[^ Z]+) (?P<stream>stdout|stderr) (?P<logtag>[^ ]*) ?(?P<log>.*)$
timestamp:
layout: 2006-01-02T15:04:05.999999999Z07:00
layout_type: gotime
parse_from: attributes.time
type: regex_parser
- id: parser-containerd
output: extract_metadata_from_filepath
regex: ^(?P<time>[^ ^Z]+Z) (?P<stream>stdout|stderr) (?P<logtag>[^ ]*) ?(?P<log>.*)$
timestamp:
layout: '%Y-%m-%dT%H:%M:%S.%LZ'
parse_from: attributes.time
type: regex_parser
- id: parser-docker
output: extract_metadata_from_filepath
timestamp:
layout: '%Y-%m-%dT%H:%M:%S.%LZ'
parse_from: attributes.time
type: json_parser
- from: attributes.log
to: body
type: move
- cache:
size: 128
id: extract_metadata_from_filepath
parse_from: attributes["log.file.path"]
regex: ^.*\/(?P<namespace>[^_]+)_(?P<pod_name>[^_]+)_(?P<uid>[a-f0-9\-]{36})\/(?P<container_name>[^\._]+)\/(?P<restart_count>\d+)\.log$type: regex_parser
- from: attributes.stream
to: attributes["log.iostream"]
type: move
- from: attributes.container_name
to: resource["k8s.container.name"]
type: move
- from: attributes.namespace
to: resource["k8s.namespace.name"]
type: move
- from: attributes.pod_name
to: resource["k8s.pod.name"]
type: move
- from: attributes.restart_count
to: resource["k8s.container.restart_count"]
type: move
- from: attributes.uid
to: resource["k8s.pod.uid"]
type: move
start_at: beginning
The log entries are then batched and shipped to Loki by using OTLP HTTP exporter.
To visualize them on Grafana, go to the Explore page and then select Loki as the datasource. Since the log data on Loki is indexed by using labels (inserted as OpenTelemetry resource fields by the filelog receiver in this case), at least one label filter must be used on the query e.g. k8s_container_name = catalog.
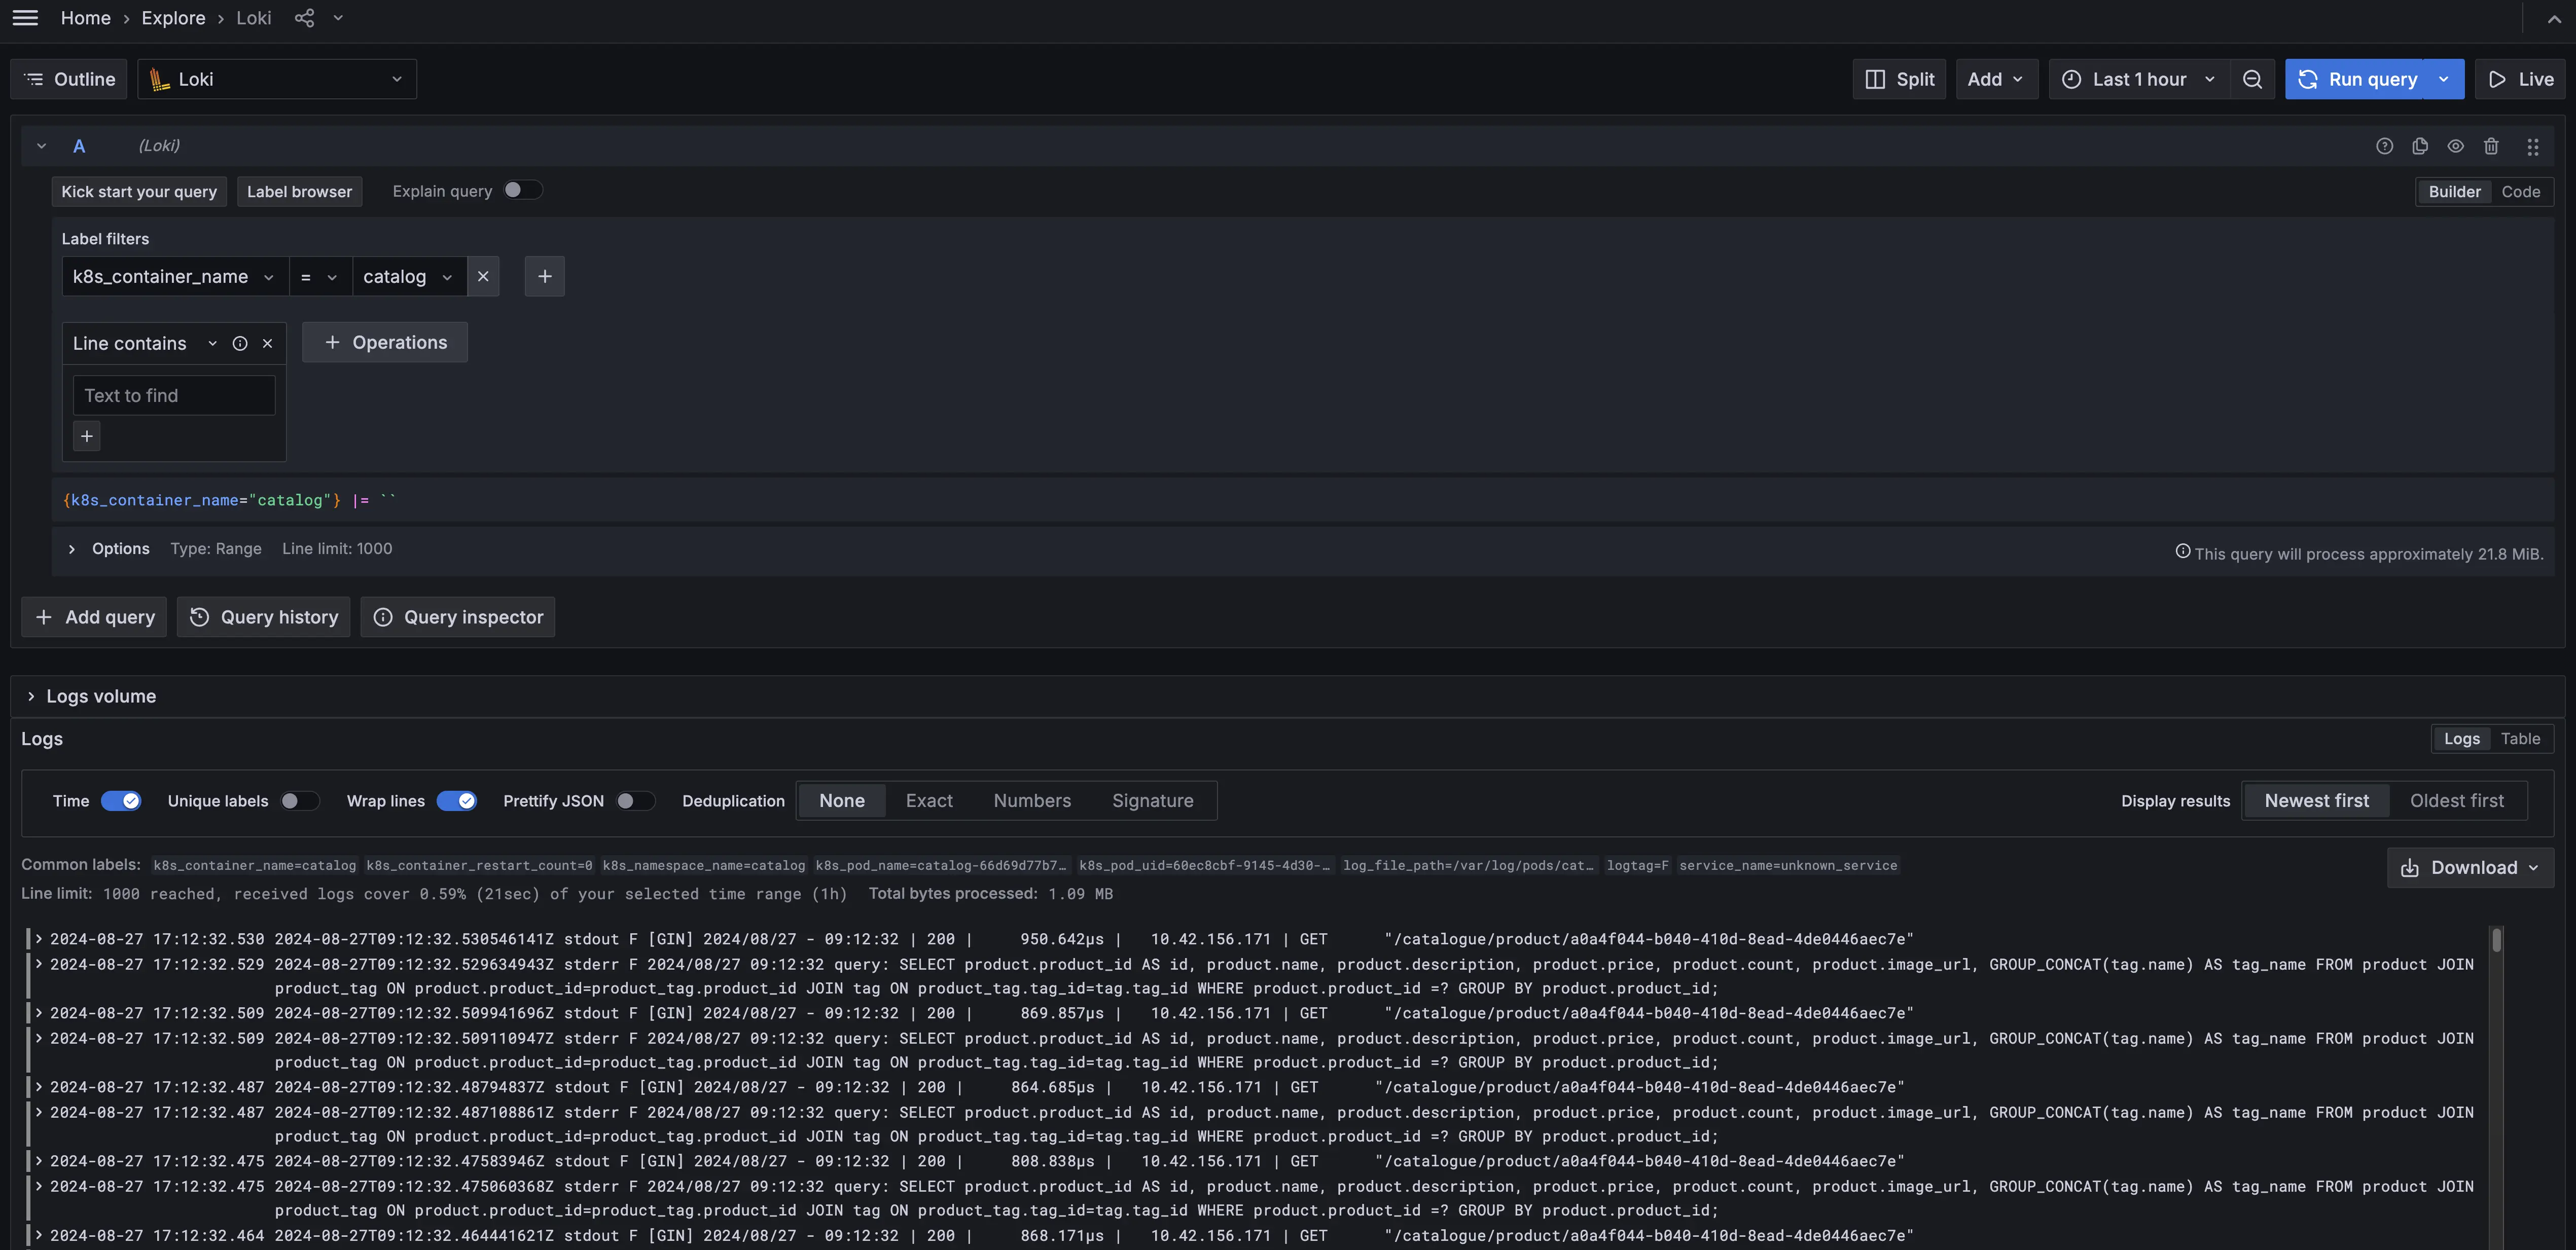
We can also use more than one label filter and/or additional log line filter expressions like string contain or RegEx.
See Log queries and Ingesting logs to Loki using OpenTelemetry Collector docs on Loki website to learn more.